
Ivan Puga-Gonzalez, Rachel J. Bacon, David Voas, F. LeRon Shults, George Hodulik, Wesley J. Wildman
Abstract
Social scientists generally take United Nations (UN) population projections as the baseline when considering the potential impact of any changes that could affect fertility, mortality or migration, and the UN typically does projections using the cohort-component method (CCM). The CCM technique is computationally simple and familiar to demographers. However, in order to avoid the exponential expansion of complexity as new dimensions of individual difference are added to projections, and to understand the sensitivity of projections to specific conditions, agent-based microsimulations are a better option. CCMs can mask hidden assumptions that are surfaced by the construction of microsimulations, and varying such assumptions can lead to quite different projections. CCM models are naturally the strongest form of validation for population projection microsimulations but there are many complexities and difficulties associated with matching microsimulation projections and CCM projections. Here, we describe our efforts to tackle these challenges as we validated a microsimulation for Norway by replicating a UN CCM projection. This provides guidance for other simulationists who seek to use CCMs to validate microsimulations. More importantly, it demonstrates the value of microsimulations for surfacing assumptions that frequently lie hidden, and thus unevaluated, within CCM projections.
Introduction
Interest in the application of agent-based modeling and microsimulation methodologies in demographic research and projections has grown in recent years (Billari & Prskawetz, 2012; Hannappel et al., 2012; Jager & Janssen, 2003; Mielczarek & Zabawa, 2021; Silverman, 2018; Wildman et al., 2021). The research presented here is part of an ongoing project that seeks to model multiple religious characteristics and behaviors over a long span of time (1900–2100) and in multiple countries (including Norway) using a simulation model that operates with a nationally representative population of agents. Given the extended time span and anticipated complexity of agent characteristics and behaviors in the model, using a top–down microsimulation approach to determine individual demographic event risk is attractive (van Imhoff & Post, 1998; Zagheni, 2015). In this article, we analyze the process of creating a microsimulation model to generate population projections, paying particular attention to complexities associated with validating the microsimulation using population projections generated through the cohort-component method (CCM). The UN provides high-quality demographic event rates for both the past and future, and we used this data to inform the microsimulation. Further, the UN’s CCM results are well accepted and served as a natural source of validation for our microsimulation’s total population output. The UN’s demographic rates are designed for a CCM, however, and adapting them was challenging even in a simple microsimulation that considers only fertility, mortality, and migration. This process surfaced many assumptions latent in CCM projections that need to be explicitly specified in microsimulation projections. These formerly latent assumptions can be varied when implemented in a microsimulation, creating quite different projections. We learned that a surface-level understanding of the UN’s data and procedures is insufficient, and several non-intuitive adjustments must be made when implementing demographic events in a microsimulation. We conclude that microsimulation is a powerful tool that both enables and requires social scientists to take responsibility for the assumptions guiding population projections. A key step in validating a microsimulation using a CCM is to replicate CCM projections using the microsimulation. We may ultimately prefer sets of assumptions other than those needed to replicate CCM projections, and the microsimulation method certainly allows us to choose any number of sets of assumptions that affect population projections other than those needed to match existing CCM projections. But beginning with CCM replication effectively validates a microsimulation, building confidence in the microsimulation method against a well-trusted standard (Morrison, 2008). For the sake of specificity, we report on the steps needed to match the figures produced by the United Nations (UN) for a single country, Norway, from 1950 to 2100. Importantly, CCMs can vary in design, such as whether projections advance in one or 5-year intervals, or whether both immigration and emigration flows are included (Smith & Swanson, 1998; Swanson & Siegel, 2004). We selected the UN’s projections as the most important source of global demographic data, and the most likely reference models for validating dynamic microsimulations—that is, models that simulate the behavior of individuals over time (Li & O’Donoghue, 2013)—in multiple countries. To refine our understanding of the UN CCM design and underlying assumptions, our team worked with UN demographers and subject-matter experts for Norway.
While CCMs have been in general use by demographers for many decades, the CCM technique is ill-suited to handling multiple dimensions of individual difference and clarifying the extent to which projections are sensitive to specific conditions (Spielauer, 2011; van Imhoff & Post, 1998; Zagheni, 2015). To illustrate, UN CCM projections take account of the age group (in 5-year cohorts) and period (also in 5-year intervals) as well as gender. They then apply fertility and mortality rates, as well as migration, specified by age, period, and gender. Each new consideration creates a geometric explosion of complexity. For example, the Pew Research Center added to UN projections the consideration of religious affiliation, which is a major factor in fertility differences (Stonawski et al., 2015). This required a monumental effort to specify fertility and migration by age, period, gender, and religion (mortality differences by religion were not included in the modeled scenarios). Adding yet another consideration, such as ethnicity, which impacts fertility, mortality, and migration, would make the projections incredibly difficult to implement. For every additional population category (e.g., marital status, region), the CCM must consider all possible combinations and how the aggregate number in each cross-category will change over time. Each cross-category may have its own fertility, mortality, and migration rates and the modeler makes explicit assumptions about whether those rates will change or hold steady into the future. Altering the assumptions allows for testing multiple scenarios, but even a single scenario becomes unwieldy to execute as its state space expands exponentially with each population characteristic.
Microsimulations mitigate these problems by specifying and adjusting the probability for individuals, instead of aggregates, to experience demographic events based on their assigned characteristics. Rates for all possible combinations of characteristics still need to be specified, or calculated through combining rates, but the calculations and output are tractable. This advantage of microsimulations has routinely been noted but CCMs are still in wide use because demographers are often only concerned with fertility, mortality, and migration by age (or birth cohort), period, and gender. CCMs are still tractable at that level of geometrically expanding complexity, so the alternative method of microsimulation is rarely considered in those cases (van Imhoff & Post, 1998).
The suggestion that microsimulations are only recommended for highly complex scenarios, gives the impression that notable discrepancies in population outputs between simulations and CCMs is due to the added complexity. We demonstrate here that, even when the only population characteristics being considered are age and sex, replicating the results of a CCM with a microsimulation approach requires the specification of numerous underlying assumptions. Many of these assumptions are latent within CCMs; they cannot be varied within the specified scenario and are rarely named or examined among non-experts or outside of technical documentation. Microsimulations, by contrast, have far greater implementation flexibility. They enable us to articulate and consider a full range of assumptions that condition population projections, and to take responsibility for whatever assumptions we make. CCMs all too easily mask this technical and ethical complexity; replication in a microsimulation brings attention to the hidden complexity of the CCM’s demographic inputs and procedures, which are taken for granted as being mathematically simple (Burch, 2018). Doing so has relevance for simulation design decisions and validation, particularly in instances where a top-down approach for demographic events is appropriate and a CCM is readily available as a source of validation.
Methods
What is the Cohort-Component Method?
The cohort-component method uses the fundamental demographic components of births, deaths, and migration to estimate and project population size from an initial population distribution by age and sex. It is based on the simple equation describing population change: the population at time t+1 is the population at time t, minus deaths that have occurred in the interval, plus births and net migration (i.e., immigration minus emigration). This approach can be refined by focusing on individual cohorts (age groups).
| Popt+1=Popt−Deathst+Birthst+Net MigratinontPopt+1=Popt−Deathst+Birthst+Net Migratinont | (1) |
Demographers produce estimates of deaths and births, using sex- and age-specific mortality and fertility rates. Hence, to project the population size at a particular point, we calculate the probability of dying by age and sex during the preceding period and deduct those deaths. We calculate the number of births that took place during the period using the age-specific fertility rates for women of reproductive age (15–49 years old). Finally, we add immigrants and subtract emigrants, again by age and sex. At the end of the period, the survivors move into the next age category (typically defined in 5-year groups) and the process starts again. Projections are usually made in 5-year intervals. Levels of mortality, fertility and migration can change from one period to the next.
What are CCMs Used for?
The CCM is the most widely-used method for projecting the size and age/sex composition of a population (Swanson & Siegel, 2004; van Imhoff & Post, 1998). The UN has prepared national-level population estimates and projections using a CCM approach since the 1950s. (“Estimates” refer to past and present populations, based on existing data; “projections” refer to future populations, based on assumptions about levels and trends.) By varying assumptions about trends in fertility, mortality and migration, demographers can produce models for different scenarios. For example, the recent releases from the UN have scenarios based on low, medium, and high fertility or zero migration up through the year 2100 (United Nations, 2019). These kinds of projections are frequently used by governments and policymakers to anticipate the future needs of their populations and inform decision-making about social services and programs (Swanson & Siegel, 2004).
How can we Validate a Population Projection Microsimulation?
Population projections based on CCMs, like those produced by the UN, are frequently used to validate dynamic microsimulations and agent-based models, to ensure that population parameters are similar to a well-trusted standard and the simulation accurately shows the impacts of death, birth, and migration on populations (García et al., 2018; Lomax & Smith, 2017; Morrison, 2008; Zaidi & Rake, 2001). As sensible and apparently straightforward as this validation procedure appears, it turns out to be challenging to execute in practice. This paper documents some of those challenges by means of a case study in which we validate microsimulation-derived population projections for Norway by replicating UN CCM projections. In the process, we document some of the many latent assumptions in the UN’s medium variant CCM, which need to be made explicit and specified in the microsimulation to achieve a close match. The specific implementation of the assumptions might seem arbitrary to simulationists, and definitely optional. However, social scientists should maintain awareness of the assumptions that go into population projections, and be ready to justify them. Using the microsimulation method requires an interdisciplinary discussion of projection assumptions.
UN Population Estimates And Projections
The UN provides two types of data: estimates of the past population and projections for the future population. The year 2020 is the end-year of the estimates and the base-year for the projections (United Nations, 2019).
The UN provides population estimates for the years 1950–2020 at 5-year intervals. These estimates are typically based on government-provided census data and vital statistics (births, deaths), which are used to construct population counts by sex and age as well as the fertility rates and life tables for each 5-year interval. (In countries where official statistics are less available or reliable, the UN uses other sources and methods.) Migration is estimated indirectly, by calculating the residual after accounting for natural increase (births and deaths) using the CCM. This residual method does not reflect the reality that some people (emigrants) leave and others (immigrants) arrive during the same period, but it is a well-accepted method when good data on migration flows are unavailable (Smith & Swanson, 1998). All rates and counts in the estimates are adjusted so that they reflect empirical observation of past time periods, and operate harmoniously within a global system of country-level projections.
From 2020 to 2100, the UN projects the population forward using a CCM approach based on different assumptions about how fertility, mortality, and migration will change into the future. The medium variant of these projections assumes that people live longer, have fewer children, and migration remains stable. For future birth and death rates, the UN applies Bayesian adjustments to the 2020 rates according to expectations of increasing life span and lower fertility, and both components converge to a global median. Migration is assumed to continue at the level estimated for the 2015–2020 period. The population is then projected forward at 5-year intervals using sex- and age-specific inputs on survival ratios, birth rates, and migration counts (United Nations, 2019).
Demographic Data
We used the data provided by the UN Department of Economic and Social Affairs (United Nations, 2019). As previously mentioned, the data give population estimates for past periods starting in 1950 and projections for the future years to 2100. Population counts are provided for males and females in 5-year age groups (5–9, 10–14, 15–19, etc.), except for the youngest and oldest ages. The youngest group is divided between infants (the first year of life) and children aged 1–4. The highest age category includes everyone 100 and above.
The UN provides detailed tables on mortality in these age groups for males and females separately (they are known as abridged life tables, by contrast with complete life tables that describe mortality by single years of age). It also provides the annual number of births per 1000 women (known as age-specific fertility rates) for women of reproductive age, i.e., in the age groups between 15 and 49.
In its published output, the UN provides the net migration count (the number of immigrants less emigrants) for each 5-year period. We needed a breakdown by age and sex, which the UN kindly provided. Table 1 shows the values for Norway for a few selected periods as examples. Note that the medium-variant projections we are replicating for the periods from 2020 assume that migration will remain at the level estimated for 2015–2020. The age of net migrants is capped at 80 or older, where all migrants aged “80+” are assigned to the 80–84 age group.
Microsimulation Model
The microsimulation was written in AnyLogic University Edition v8.7.4 (documentation and code can be found in https://github.com/centerformindandculture/adapting-cohort-component-methods-to-a-microsimulation). Norway’s population in 1950 was 3,265,274. We did not have the computational power needed to run a simulation with three million individuals, so we initialized the model with a population of 32,653, a 1% sample. Simulating with a 1% baseline population as opposed to 100% of the Norway population balances computational efficiency with the needs of the project. Simulating a small proportion is a relatively common design decision for microsimulations of large populations, such as the CORSIM (based on a 0.1% sample of the U.S. census) and APPSIM (1% sample of Australian census) national simulations (Li & O’Donoghue, 2013). It is certainly possible to use the entire Norwegian population, but doing so is unnecessary when the sample is representative of the true population in terms of age, sex, and assignment of demographic events (Zagheni, 2015).
A key challenge in producing our microsimulation is that we want to work with single-year age groups and time steps of 1 year. This decision on the treatment of time and age groups aligns with the needs of our project at a later stage. In the UN data, however, mortality, fertility, and migration are all provided for 5-year age groups over 5-year periods, as described above. An additional challenge is to identify the correct order of operations, so that the risks of mortality, fertility and migration are sequenced in a way that accords with the CCM.
Our basic approach is as follows. At initialization, the distribution of the population by age and sex matches that reported by the UN for the year 1950. Thereafter, every year, every individual has a probability of dying determined by their age, sex, and the time period. Individuals drop out of the population on death. Female individuals of reproductive age may give birth, with the probability depending on age and year. Births create a new individual of age 0 and a probability of being male or female depending on the prevailing sex ratio at birth. Further additions or deductions from the population occur in each period according to the statistics on net migration. The cycle is repeated for simulation runs from 1950 through 2100.
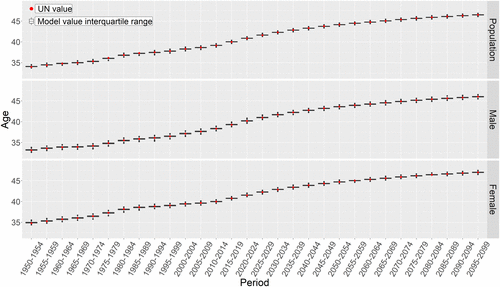
Output from the simulation is generated for every 5-year period for comparison with UN estimates and projections. We collect counts of the total population, births, deaths and immigrants or emigrants. Birth, death, and growth rates can be calculated from these values. We also calculate the mean age and standard deviation.
Following 1000 runs of the simulation, we calculate the interquartile range for each of these statistics. If the values reported by the UN fall within that range (i.e., the two middle quartiles), we consider the model to be acceptably accurate. Further, we used two other metrics to compare the accuracy of the microsimulation in replicating the CCM values. The first metric was calculated for every 5-year time period and represents the proportion of times the microsimulation values (i.e., population size; number of births and deaths; and average age of the whole, male, and female population) were higher (H) or lower (L) than the corresponding UN value. The metric thus assesses whether the UN value falls within the distribution of values generated by the microsimulation or in the extremes of the distribution. This procedure is analogous to procedures used in social network analysis where finding statistical significance requires the creation of null models (Hobson et al., 2021). Using this procedure, a ‘p-value’ can be calculated by determining whether the UN value is higher (H) or lower (L) than 95%, 99% or 99.9% of the values generated by the microsimulation. The second metric is the average of the absolute differences between the UN values and the corresponding microsimulations values divided by the average UN value. This metric was calculated for 50-year time periods. It gives an estimate of the percentage of error between the microsimulation and the UN values.
Our initial results showed significant discrepancies between the output from the model and the UN figures we aimed to replicate (see supplementary material). The microsimulation generated too few births, especially during the 21st century. In addition, the average age in the simulated population was systematically too high. In the next section, we detail the steps required to bring the microsimulation into alignment with the UN data.
Reproducing the UN data
Adjusting the microsimulation model to replicate the CCM results involved a number of steps, some of which are far from intuitive. The CCM and microsimulation approaches work very differently. In arriving at population estimates for previous decades, the UN examines data from a variety of sources (in this case, primarily the Norwegian national statistics agency) covering every 5-year period. By examining this dataset, the UN estimates fertility/mortality rates and emigrant/immigrant numbers that bridge the exact population numbers from one time-period to the next one. The results are designed to be internally consistent, so that the CCM will go from the previous counts to the current ones. Fertility rates are made consistent with the number of births during the interval and the number of women in each age group at the beginning and end of the period. Similarly, life table rates must be consistent with the number of deaths and the population counts by age and sex. Net migration is what remains once natural growth has been considered. The estimation procedure is thus largely retrospective because all of the counts and rates are adjusted to reflect empirical observation at the end of each period. By contrast, the microsimulation is entirely prospective, in that it starts from the initial population in 1950 and then runs its course. Our model uses the UN statistics on fertility, mortality, and migration for each successive period, but there are no ad hoc adjustments in mid-stream. Therefore, it is not possible to assess which model, the microsimulation or the CCM, has better accuracy for past periods. Of course, we also lack census data on future populations. Thus, we assess the accuracy of the microsimulation by estimating how well it fits the UN values generated via the CCM.
Mortality
The abridged life tables contain a variety of measures of mortality and its complement, survival, and we use the UN’s life table labeling and notation hereafter. The statistic used to construct the life table is the central death rate, labeled m(x,n). It is calculated by taking the number of people who are at least age x but not yet x+n when they die, divided by the number of people in that age group. The microsimulation uses this value as the most suitable expression of mortality risk. Note that the CCM employed by the UN uses the survival ratio, labeled S(x,n), which is roughly speaking the average count in one age group divided by the average count in the one below, assuming a stationary population. We originally supposed that the survival ratio would give us the best chance of replicating the UN figures and used it to derive an annual probability of dying. We came to realize, however, that this approach is inappropriate in a model with single-year age groups. As an example, consider the proportion of people aged 65–69 who survive to be 70–74 5 years later. Many of the deaths affecting individuals in this group would have occurred when they were in their early 70s, and so the risk of mortality implied by the survival ratio should not be applied to people aged 65, 66 … 69.
| d(0,1)−(l(0)−L(0,1))L(0,1)d(0,1)−(l(0)−L(0,1))L(0,1) |
The microsimulation proceeds in discrete steps of 1 year (rather than the 5 years of the UN CCM). Because aging is continuous, however, some people will have their birthdays in the first half of the year, potentially affecting the rates that apply to them. A woman of 24, for example, might move into the 25–29 category for fertility and mortality by mid-year. We addressed this problem by splitting each year of age into two equal groups, corresponding to dates of birth in the first or second half of the year. For most individuals in most years, the half-year age bins make no difference. For individuals on the cusp of the next age category, however, half will experience the mortality and fertility rates for the age group they belong to at the beginning of the period, while the other half will experience the mortality and fertility rates of the next age group.
Births during the year produce an additional problem of calculating how much infant mortality to attribute to which period. Births in a given year should be multiplied by L(0,1)/l(0) to give the count aged 0 in the following year. L(0,1) is the life table value for the number of person-years lived in the 12 months following birth, given a cohort size of l(0). In addition, however, the starting population includes infants below 1 year of age, that is, children aged 0 (who will be one the following year). In order to account for all of the deaths in the life table, we need to apply the remainder of infant mortality. Any snapshot of the age 0 population will include both recent newborns and infants approaching their first birthday. Such a count will reflect some deaths that have already occurred (which we can calculate as l(0) – L(0,1)), but not the full extent of deaths in the first year of life (d(0,1)). The difference can be divided by the size of the infant population to give the death rate for children aged 0:
Migration
As mentioned above, the UN accounts for natural increase in a 5-year interval, compares the result with data on the population at the end of the period, and then takes the residual to be net migration. That being so, it is tempting to program the microsimulation to add or subtract migrants at the end of each period, once all of other processes have been executed. The situation is more complicated, however. The number of births is influenced by the number of immigrants and emigrants. In the CCM, fertility is calculated by applying the age-specific fertility rates to the mid-period population, which is a simple average of the starting and ending populations for the 5-year period. As migrants are included in the count at the end of the period, half of them are effectively included in the mid-point average. Our initial results underestimated the number of births from 2005 onwards because we were not adding immigrants (whose numbers had greatly increased by this point) until the end of each period.
We need to add immigrants and subtract emigrants every year. The challenge is to do so in a way that is consistent with the CCM calculations. Because the migrant numbers are only estimated at the end of each 5-year period, any immigrants included in that count have by definition survived to the end of the period. Hence, if we are adding them year by year in the microsimulation, they need to be preserved from dying until subsequent periods. Similarly, their ages also need to be held constant during the 5-year period of their arrival. (We could assign younger ages on arrival so that they age into the correct group, but then they would be subject to the wrong age-specific fertility rates.) We assume that migratory events are spread evenly over the year, and hence half of the net migrants in each year are exposed to the risk of childbearing and the other half are not.
As a final point of detail, note that the UN supplies net migrant counts as integer values for each 5-year period. When the number is not a multiple of five, the annual net migrant count cannot be constant. In such cases we alternate the high and low values, with the center of gravity in the middle year. For example, if over 5 years there are 30 immigrants in a particular age group, they would be distributed as 6,6,6,6,6 in each year; if the total is 29, the distribution is 6,6,5,6,6; 28 is divided as 6,5,6,5,6; 27 as 5,6,5,6,5; and 26 as 5,5,6,5,5. Similarly, the same number of immigrants can only be allocated to the first and second half of the year when the annual total is an even number. When it is odd, we alternated rounding up or down for the first half year.
The sequence of events in each year in the simulation is:
- Everyone is aged half a year to the mid-point.
- Half of immigrants for the year are added and exposed to the risk of childbearing; newborns of immigrants are added as normal members of the population. Half of emigrants are removed (prior to exposure to childbearing).
- The host population is exposed to risks of fertility and mortality.
- The second half of immigrants for the year are added (with no exposure to risk of childbearing). The second half of out-migrants is removed (after exposure to childbearing).
- Non-immigrants are aged half a year.
Results
After the adjustments to the microsimulation outlined above, the results of the microsimulation for Norway are very similar to the UN’s estimates and projections. As shown in Figures 1 and 2, the UN statistics always fall within the interquartile range of the simulated values (see supplementary material for results of the simulation without adjustments). This is further corroborated by the results shown in Tables 2 and 3. Table 2 shows the proportion of times the microsimulation values (n = 1000) were higher (H) or lower (L) than the UN value. In no case were more than 80% (or less than 20%) of the values of the microsimulation higher (or lower) than the UN value. Hence, for all variables, the UN value always falls well within the distribution of values generated by the microsimulation and never at the extremes. Table 3 shows the percentage of error between the UN and the microsimulations values for three 50-year periods. Before adjustments, errors more than double with time for total population and births, and for births the error increased up to over 5% for the 2050–2100 period (Supplemental Table S2). In contrast, after adjustments errors were kept to a minimum, with total population around 1% and births under 2% error (Table 3). Adjustments are thus particularly important for long-running simulations, where initially small errors will become problematic later. Further, by comparing the errors to the annual population growth in Norway, ∼0.6%, and over 2% in other countries (World Bank, 2019), we note that over a 50-year period the simulation goes off target by no more than the change expected in a year or two.
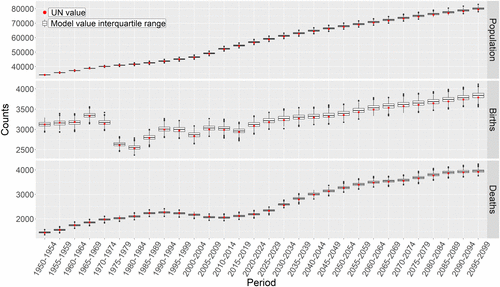
Despite the improvements, the microsimulation still slightly overestimate the number of births from around 2050 onwards (average difference between median and projected UN value for periods 2050–2100 = 39.8, i.e., 1.11% more births than projected by the UN, Figure 1). Nevertheless, for our practical purposes the model does what is needed. Below we discuss the potential sources of the remaining discrepancies between the microsimulation and the UN data.
The CCM and microsimulation approaches have fundamental differences in their underlying assumptions (van Imhoff & Post, 1998; Zagheni, 2015). We struggled most with the translation of birth, death, and migration statistics in our microsimulation. In the CCM, birth and death rates are expressed as the average exposure to risk experienced by people who are aging into and out of 5-year age groups over a 5-year period. In our microsimulation, we converted the UN’s rates into probabilities of an individual experiencing an event at a specific age in a specific year.
Although our adjustments reduced output discrepancies to low levels, there is still a slight drift away from the expected number of births. This drift is only noticeable in projections from the mid-21st century and may reflect a gradual accumulation of error. Immigration to Norway surged in the early 21st century and remains relatively high in the UN’s projections to the end of the century. Our corrected models allow half of immigrants to contribute to fertility during the period of arrival, which produced an overall improvement. Even a few too many births would lead to even more excess births when the extra individuals reach child bearing ages, however, and it is possible that an imperfect correspondence between the microsimulation and the UN target produces the slight birth surplus after the year 2050.
Conclusion
Throughout our troubleshooting and expert consultations, we were surprised at how little guidance was available for designing a relatively straightforward microsimulation of population change. Do we use data on both immigration and emigration or net migration? Do we use the central death rate or the survival ratio? What are the consequences of using 1-year intervals? The lack of guidance on sources of discrepancy between microsimulations and various CCM models can lead to confusion among simulators who use existing CCMs to validate their microsimulation projections. A common criticism among simulationists is a lack of documentation on design decisions and model validation approaches (Li & O’Donoghue, 2013). A side benefit of the procedure documented in this paper is the provision of such guidance to people building microsimulation projections.
The central message of this paper, however, is that microsimulations expose assumptions that are latent in CCM population projections, even when the CCMs are simple, focusing only on age and sex. We have demonstrated that implementing a simple scenario of population change with typical demographic rates can lead to divergences between microsimulation and CCM projections that are unrelated to more complex individual characteristics such as social network or kinship ties.
Of course, microsimulations are able to incorporate increasingly more complex individual characteristics and interactions (that are too unwieldly for traditional CCM approaches) while simultaneously maintaining a realistic population composition and size. Therein lies their primary advantage. This additional complexity is not tractable in a CCM approach, which can only operate in aggregates of mutually exclusive population categories (e.g. racial groups by religion, by region) and cannot maintain kinship ties (van Imhoff & Post, 1998). Added complexity, however, brings up new challenges. One limitation of microsimulations is that they require much more computational power than traditional CCM. Another one is the scarcity of quality demographic data needed to inform the simulation. Given the added complexity at the individual level, researchers may have a difficult time finding data for specific areas, to interpret the most appropriate rates to use, specify the order of demographic events, etc. Nevertheless, by focusing on events and processes at the individual level, rather than the aggregate, microsimulations allow us to understand the sensitivity of projections to many different conditions. Hence, we believe that microsimulations have an important role to play in demographic projection, and simulationists and CCM experts mutually benefit from more interdisciplinary dialogue and explicit defense of projection model assumptions.
In future work, our team plans to explain the virtues of the microsimulation method for population projection in more detail. We also wish to assess the “price” of microsimulation options in divergence of demographic variables from normal benchmarks. We are also developing other models that will document the validation process for population projection microsimulations by parametrizing all assumptions made in the CCM-implementation process.
Acknowledgments
Patrick Gerland, PhD (Chief of Population Estimates and Projections Section at the United Nations Population Division) confirmed the calculation and implementation procedures of the UN’s cohort component model for Norway and provided net migrant estimates by age and sex. Anne Morse, PhD (Survey Statistician at the U.S. Census Bureau) provided early input and feedback on replicating cohort component model output. We also acknowledge support from the John Templeton Foundation grant # 61074 – note that the findings of this paper do not necessarily reflect the views of the John Templeton Foundation.
Declaration of Conflicting Interests
The author(s) declared no potential conflicts of interest with respect to the research, authorship, and/or publication of this article.
Funding
The author(s) disclosed receipt of the following financial support for the research, authorship, and/or publication of this article: This work was supported by the John Templeton Foundation (Modeling Religious Change / #61074).
Supplemental Material
Supplemental material for this article is available online.
References
| Billari, F. C., Prskawetz, A. (2012). Agent-based computational demography: Using simulation to improve our understanding of demographic behaviour. Springer Science & Business Media. Google Scholar | |
| Burch, T. K. (2018). The cohort-component population projection: A strange attractor for demographers. In Model-Based Demography (pp. 135–151). Springer. https://doi.org/10.1007/978-3-319-65433-1_10. Google Scholar | Crossref | |
| García, W., Maldonado, N., Camacho, S., Arango, C., Cueto, E., Ortíz, M. (2018). A microsimulation model for population projection in Colombia. PAA 2018 Annual Meeting. Google Scholar | |
| Hannappel, M., Troitzsch, K. G., Bauschke, S. (2012). Demographic and educational projections. Building an event-oriented microsimulation model with CoMICS II (pp. 613–618). ECMS. Google Scholar | Crossref | |
| Hobson, Elizabeth A., Silk, Matthew J., Fefferman, Nina H., Larremore, Daniel B., Rombach, Puck, Shai, Saray, Pinter-Nolan, Noa (2021). A guide to choosing and implementing reference models for social network analysis. Biological Reviews, 96, 2716–2734. http://doi.org/10.1111/brv.12775 Google Scholar | Crossref | Medline | |
| Jager, W., Janssen, M. A. (2003). Diffusion processes in demographic transitions: A prospect on using multi agent simulation to explore the role of cognitive strategies and social interactions. In Agent-Based Computational Demography (pp. 55–72). Springer. Google Scholar | Crossref | |
| Li, J., O’Donoghue, C. (2013). A survey of dynamic microsimulation models: Uses, model structure and methodology. International Journal of Microsimulation, 6(2), 3–55. https://doi.org/10.34196/ijm.00082 Google Scholar | Crossref | |
| Lomax, N. M., Smith, A. P. (2017). Microsimulation for demography. Australian Population Studies, 1(1), 73–85. https://doi.org/10.37970/aps.v1i1.14 Google Scholar | Crossref | |
| Mielczarek, B., Zabawa, J. (2021). Modelling demographic changes using simulation: Supportive analyses for socioeconomic studies. Socio-Economic Planning Sciences, Elsevier, vol. 74(C). http://doi.org/10.1016/j.seps.2020.100938 Google Scholar | Crossref | |
| Morrison, R. (2008). Validation of longitudinal microsimulation models. DYNACAN Practices and Plans. Google Scholar | |
| Silverman, E. (2018). Methodological investigations in agent-based modelling: With applications for the social sciences. Springer Nature. Google Scholar | Crossref | |
| Smith, S. K., Swanson, D. A. (1998). In defense of the net migrant. Journal of Economic and Social Measurement, 24(3–4), 249–264. https://doi.org/10.3233/JEM-1998-0150 Google Scholar | Crossref | |
| Spielauer, M. (2011). What is social science microsimulation? Social Science Computer Review, 29(1), 9–20. https://doi.org/10.1177/0894439310370085 Google Scholar | SAGE Journals | ISI | |
| Stonawski, M., Skirbekk, V., Hackett, C., Potančoková, M., Connor, P., Grim, B. (2015). Global population projections by religion: 2010–2050. In Yearbook of international religious demography 2015 (pp. 99–116). Brill. Google Scholar | |
| Swanson, D. A., Siegel, J. S. (2004). The methods and materials of demography (2nd ed.). Emerald Publishing Limited. Google Scholar | |
| United Nations (2019). World population prospects 2019: Methodology of the united Nations population estimates and projections. Department of Economic and Social Affairs, Population Devision. Google Scholar | |
| van Imhoff, E., Post, W. (1998). Microsimulation Methods for Population Projection. Population: An English Selection, 10(1), 97–138. http://www.jstor.org/stable/2998681 Google Scholar | |
| Wildman, W. J., Shults, F. L., Diallo, S. Y. (2021). Computational Demography of Religion: A Proposal. In Ahrweiler, P., Neumann, M. (Eds.), Advances in Social Simulation. Springer Nature. Google Scholar | Crossref | |
| World Bank (2019). World development indicators. Population growth (annual %) [Data file]. Retrieved from https://data.worldbank.org/indicator/SP.POP.GROW Google Scholar | |
| Zagheni, E. (2015). Microsimulation in demographic research. International Encyclopedia of Social and Behavioral Sciences, 15, 343–346. https://doi.org/10.1016/B978-0-08-097086-8.31018-2. Google Scholar | Crossref | |
| Zaidi, A., Rake, K. (2001). Dynamic microsimulation models: A review and some lessons for SAGE. In Simulating social policy in an ageing society. SAGE. Discussion Paper, 2. Google Scholar |
Author Biographies
Ivan Puga-Gonzalez is a senior researcher at the NORCE Center for Modelling Social Systems in Kristiansand, Norway. His research interests are modeling and social simulation of complex adaptive human and non-human social systems. He holds a PhD in Theoretical Biology from the University of Groningen.
Rachel Bacon is a postdoctoral fellow at the Center for Mind and Culture in Boston, MA. She is a sociologist and demographer specializing in immigration, health, religious populations, and spatial analytic methods. Her research interests include religious growth and decline, immigrant dietary acculturation, mapping and spatial regression. She has written about spatial approaches to religious change in Spatial Demography and the Spatial Analysis entry of the Online Oxford Bibliographies for Sociology.
Wesley J. Wildman is Professor of Philosophy, Theology, and Ethics in the School of Theology and Professor in the Faculty of Computing and Data Sciences at Boston University. He is a philosopher specializing in the scientific study of complex human social systems, including religion. Author or editor of over 20 books and 160 articles and book chapters, his research and publications pursue a multidisciplinary, comparative approach to practical and philosophical questions surrounding pressing social problems. He is Executive Director of the Center for Mind and Culture (www.mindandculture.org), and founding co-editor of the Taylor & Francis journal Religion, Brain & Behavior. He is principal investigator on many research initiatives, including some that apply computing and data sciences to the scientific study of religion and complex social problems. For further information, see www.WesleyWildman.com.
F. LeRon Shults is professor at the Institute for Global Development and Planning at the University of Agder and research professor at the NORCE Center for Modeling Social Systems in Kristiansand, Norway. He has published 19 books and over 150 articles and book chapters on topics such as philosophy of religion, philosophy of science, computer simulation, and cognitive science of religion. Shults’ recent books include Practicing Safe Sets: Religious Reproduction in Scientific and Philosophical Perspective (Brill, 2018) and Human Simulation: Perspectives, Insights, and Applications (Springer, 2019, co-edited with Saikou Diallo, Wesley J. Wildman, and Andreas Tolk).
David Voas is a professor at University College London, where he led the UCL Social Research Institute until 2020. He is a demographer and sociologist of religion. His research interests include religious change and value change in modern societies, the intergenerational transmission of religion and values, and related topics. David was the European Values Study national programme director for Great Britain from 2008 to 2020 and served on the EVS Executive Committee for most of that period. He is on the editorial boards of the British Journal of Sociology and the Journal for the Scientific Study of Religion.
George Hodulik is a Creative Solutions Designer at the Center for Mind and Culture in Boston, MA. Formerly working in the software industry for companies such as Google and Epic Systems, George now works on computational social science research and software solutions to support such research. George’s work extends across computational modeling, data analytics, and software development.