About the data
The core goal of MRC is to build a theoretically integrated, data-validated, assumption-relative demographic forecasting system based on a big-theory understanding of (non)religious identity and change. To achieve this goal, our team has collected vast amounts of data in three countries: the USA, Norway, and India. These simulations will replicate the ambiguity of religious dynamics with artificial agents who experience religious identity like real people do. The agents live and move within an artificial world that mirrors the complex social context of religious switching as it changes over time.
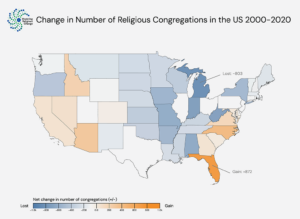
USA

There is no religion question on the government census in the US, but survey responses about religious self-identification are reasonably reliable. While Christianity is the largest religious population in the country, MRC takes seriously a broader array of religious traditions including Muslims, Hindus, Buddhists, and Jews. Yet, the USA is home to large populations of people who identify with no religion even though they may still believe in God and pray regularly.
MRC is creating a database of survey data on religiosity in the US dating back to the 1940s. Using questions about the religiosity of parents from the General Social Survey and other surveys, we are able to extend our picture of some aspects of religiosity in the US even further into the past.
Norway

Norway is an example of a country with vast differences between religious self-identification (i.e., on surveys and tax forms) and religious practices and/or beliefs (i.e., religious service attendance, prayer and meditation, belief in supernatural agents). Secularism and atheism/agnosticism are extremely widespread, yet census responses indicate a Christian (mostly Lutheran) majority. In recent years, a high influx of non-Christian immigrants to Norway is increasing religious diversity in the country, and exposing more Norwegians to alternative identities, practices, and beliefs.
By measuring dimensions other than identity, our team can create more nuanced projections of religion in places where formal affiliation is a poor reflection of the population’s other religious characteristics. Fortunately, many other data sources exist to help fill out the story. Norway is included in many international surveys, including some that capture information about religiosity in addition to identity.
India

Multiple religious identity is common in India, and the kinds of public/private practices and beliefs present are different from Christian-majority nations. How we synthesize data needs to be rebuilt from the ground up to accommodate the very different cultural and economic realities and the complex relationships among Hinduism, Islam, Christianity, and those with no religious identification. MRC also takes into consideration religions with millions of adherents, even if they are considered “minorities,” such as Sikhs, Buddhists, and Jains.
In India, survey data is extremely limited, often only asking about Christian practices and beliefs. We are supplementing existing surveys with religious data from an ethnographic collection called the People of India. Integrating archived qualitative data and newer survey data poses its own challenge, but we believe doing so will give a more accurate picture of the religious landscape.
Novel datasets for novel insights
Dataset of Integrated Measures of Religion (DIM-R)
Religious Identity and Change (RICH-USA)
*RICH data for Norway and India will be available soon
Data sources:
European Social Survey (ESS), International Social Survey Programme (ISSP), European Values Survey (EVS), World Values Survey (WVS)
Measures:
- Identity: affiliation
- Practices: prayer, attendance
- Values: self-described religiosity
- Demographics: gender, age
Survey size:
More than 1.2 million people across 119 countries
Time period:
1980-2021
Applications:
Analyze differences by country, time, affiliation, and birth-cohort across multiple measures of religiosity.
Data sources:
WVS, General Social Survey (GSS), American National Election Survey (ANES), Historical Surveys (Gallup, NORC, others), Global Attitudes Project (GAP), Pew Surveys (general population and religion-specific), National Survey of Family Growth (NSFG), Integrated Fertility Survey Series (IFSS), Faith Matters Survey (FMS), Baylor Religion Survey (BRS)
Measures:
- Identity: affiliation, denomination
- Practices: prayer, attendance, reading scriptures, meditation, confession
- Values: self-described religiosity, importance of religion/god/spirituality/ceremonies, scriptural literalism, attitudes toward other religions
- Beliefs: afterlife, god, evil, angels, demons, reincarnation, astrology
- Demographics: gender, age, race, education, nativity, number of children, census region
Survey size:
About 1.1 million people in the United States
Time period:
1940-2020
Applications:
Estimate American religiosity across different measures and between different demographic groups. Compare trends in religiosity measures and analyze the impact of survey-specific measurement assumptions on those estimates.
Input data
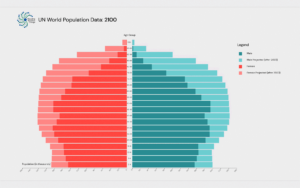
In order to build realistic models, our data team has collected and collated data from each of the countries we are studying. Change in population size is determined by three factors: how many babies are born (fertility), how many people die (mortality), and how many people enter or exit that geographic region (migration). However, when we bring religion into the picture, there are some additional nuances we have to consider. For example, fertility rate varies between religious groups. Additionally, we are analyzing religious switching, which describes when someone changes their (non)religious identity. These numbers vary by religion and country. For example, many people are leaving religion to become nonreligious in the West, but in countries like China, people are increasingly turning from non-religion to religion. We’ve synthesized these factors and more from demographic statistics (the United Nations, Pew Research Center, and census data), values and belief surveys (the European Social Survey, World Values Survey, European Values Survey, and International Social Survey Programme), as well as ethnographic and qualitative sources. The result is novel datasets, which serve as the foundation for our demographic projections and computational models.
We also rely on our dimensions of religiosity to harmonize measures from different cultures and time periods. By including multiple dimensions of religiosity in our databases, we improve our ability to identify varying levels of religiosity, even among the non-religious. We also avoid stereotyping “religion” and leave our data open to many different forms of religion, belief, culture, and worship. Our projections based on this data will provide a more multi-dimensional picture of the religious landscape than those based only on identity. This helps to build the behavior of individual agents in our artificial societies.
To create our agent-based models, we initialize the population with the proper demographic make-up: gender, age, and (non)religious affiliation, using real-world demographic data. Rates of fertility, mortality, migration, and religious switching are built into the causal architecture (the underlying calculations and parameters that determine agent decisions and interactions). We also incorporate data that reflects a synthesis of the best theories of religious and nonreligious identity and change for the countries we are studying. These theories incorporate family relationships, peer interactions, societal conditions, and other factors that are nearly impossible to capture in traditional demographic models.
Validating our data
Complex societal patterns ultimately emerge from individual decisions. Similarly, when thousands of agents interact in an artificial society, interesting and unpredictable results emerge. We test the results against real-world data to validate that our model is accurate to real life. For example, we check that the number of children born in our model matches the expected rates of that population and time period. In an agent-based model, forming a family must follow a set of rules: How do agents “decide” to have a child? When and if to get married? To whom to get married? In an artificial society, to whom a new agent is “born” matters, because the characteristics of the parents directly influence the characteristics of their child. New agents make decisions based on their peer and family relationships as they move through time. Once we have coded our models based on various theories of religious change, our developers set up equations that allow societal-level factors such as religious pluralism, education, and overall religiosity to influence how agents make decisions.
Many trial runs and fixes are needed to validate the causal architecture. After each unsuccessful simulation, we slightly alter the initial conditions, rules, and the level of influence different variables hold on each other. Researchers must conceptualize the range of different possibilities and understand the influence of starting conditions and the specific order of calculations in the causal architecture. This process of calibrating and validating the model may be done manually, algorithmically, or by a mix of both. Once the model produces the expected results according to past and present-day real-world data, then we may use it to project the future of religious change with more confidence.
Model output data
Each country-specific computational simulation builds on the historical and behavioral input data in order to generate output data, projecting several decades into the future. We run the model hundreds of times to test multiple combinations of parameter settings. By running each combination several times and permitting a level of randomness, we build our confidence in the patterns that emerge. This output dataset projects numbers for affiliation and other dimensions of religiosity within major religious and non-religious categories.
The datasets will be complex, demonstrating the dependence of projections on methodological and theoretical assumptions, and sensitivity of those results to particular parameters. We create data containers that prepare the multi-dimensional output data for analysis and compare them to existing projections from organizations like Pew and the World Religion Database. Our assumption-relative tool (ARDEMIS) displays results in a comparative way so that the effect of measurement assumptions on demographic forecasts can be visualized. The forecasting system supports multiple interpretations of religious change and shows explicitly what assumptions make the difference in producing different forecasts.